Area & Occupancy rate
| Leasable Area (Sq.m.)1 | Occupancy rate (%)2 | ||||
|---|---|---|---|---|---|
| FY2018 | FY2017 | 4Q2017 | 4Q2018 | ||
| Anchor & Retail Shop | 56,965 | 96 | 97 | 97 | 97 |
Remark:
1. Leasable Area (Sq.m.) and occupancy rate is calculated from average monthly data in 4Q2018
2. In 2018, the accumulative areas that the Fund has temporarily delivered to Rangsit Plaza Co.,Ltd. for connecting the existing building with the expansion building as at the end of year 2018 was 1,876.94 sq.m. Rangsit Plaza Co.,Ltd. has paid the rental revenue in compensation for those areas to the Fund.
Traffic Performance 4Q 2018
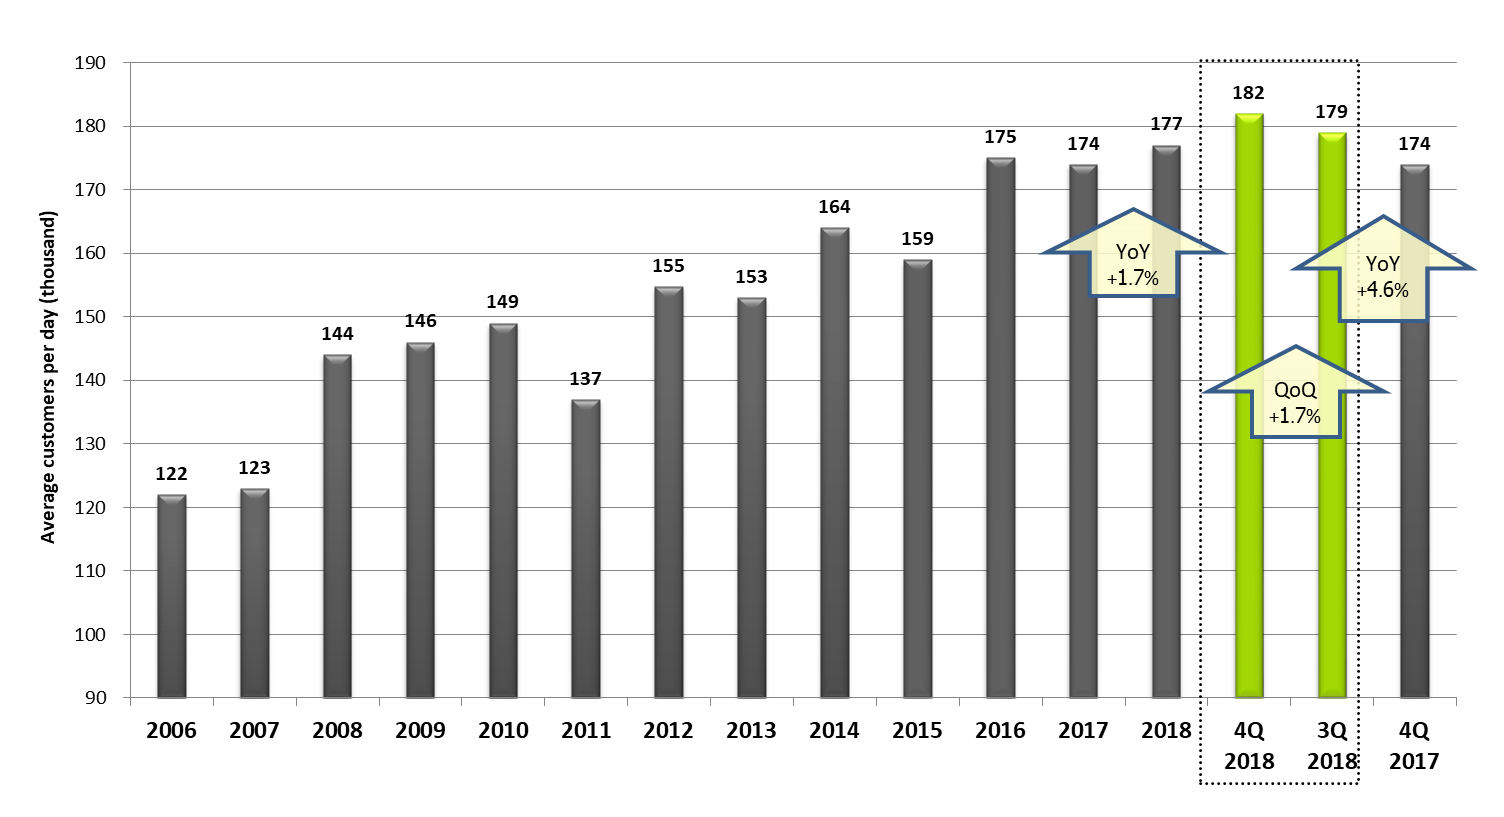
In 2018 the number of customer visiting Future Park was at an average of 177,000 customers per day, increasing +1.7% YoY. In the fourth quarter of 2018 the number of customers visiting was at an average of 182,000 customers per day, increasing +4.6% from the same period last year. Comparing with 3Q2018, the number of customers visiting increased by 1.7%.
Renewals and New Leases
| Renewals and New Leases1 | Increase /(Decrease) in Rental Rates | |||
|---|---|---|---|---|
| FUTUREPF Portfolio | No. of Leases | Area (sq.m.) | % of Total area2 | |
| 4Q 2018 | 59 | 5,981.82 | 10.50% | 0.32% |
| FY 2018 | 312 | 21,762.56 | 38.20% | 3.65% |
| Remark: |
1. Retail & Anchor agreements (exclude common area agreements) 2. Percentage of total rental space in 4Q 2018 |
Lease Profile
Type of Rental
|
Lease Term
|
| Remark: | 1. Retail & Anchor agreements (exclude common area agreements) 2. Percentage of total rental space as of Dec 31st , 2018 |
Lease Expiry Profile

| Remark: | 1. Retail & Anchor agreements (exclude common area agreements) 2. Percentage of total rental space as of Dec 31st , 2018 |